Tea For Streets

That 21 percent is the strongest independent anchor we have. Building around it, we think jurisdiction screening, structured intake, and proactive status tracking could put the deflectable share of phone contacts associated with routine street conditions in a 20 to 35 percent range. We have not measured that result against a city's call logs. It is a testable hypothesis, and the assumptions are below.
The short version
- Scale: NYC311 handled 17.5 million phone calls and 27.5 million inquiries in FY2024 while completing 3.6 million service requests. These are separate performance measures, but they show that 311 handles much more than request intake alone.
- Cost: a live 311 call costs about $3.39 on average across 15 cities (Pew), $4.50 in Minneapolis (Gartner), and $11 to $16 in Toronto (2024). A web or app transaction costs 10 to 50 cents.
- The Los Angeles problem: 311 transfers over 40 percent of answered calls; the Controller estimated a 21 percent call volume reduction from fixing the top five transfer types alone.
- Our receipt: 45 percent of the distinct sites residents tried to report through CLARK AI this summer were outside the City of Los Angeles. Without jurisdiction screening, each represented an opportunity for a resident to start with the wrong agency.
- Hypothesis: 20 to 35 percent of phone contact volume associated with routine street conditions may be deflectable with jurisdiction checks, structured intake, and status tracking. We have not measured that result against a city's call logs.
What 311 actually spends its day on
311 was designed as a single front door. Baltimore opened the first in 1996; Los Angeles followed in 2002 with the goal of a one stop shop for non emergency services. The idea was that a resident should never need to know which of dozens of departments owns a pothole, a streetlight, or a couch on the curb.
Two decades in, the door works, but its job is broader than creating work orders. New York publishes unusually detailed performance data. In fiscal 2024, NYC311 handled 17.5 million phone calls, 2.2 million mobile app contacts, 18.2 million website visits, and 27.5 million inquiries, while completing 3.6 million service requests. These figures are different measures of activity and should not be treated as a single conversion funnel, but they illustrate how much of 311's role sits around the service request itself.
Los Angeles created 1.75 million service requests in 2020. Its mobile app and website already carry 80 percent of the requests that come through 311's own channels, up from 51 percent in 2016, which is real progress. But the Controller's 2021 audit, "The 411 on 311," found the phone side still behaves like the switchboard the Controller had criticized in 2014: more than 40 percent of answered calls are transferred elsewhere, over 70 percent of building and safety calls among them, and average wait time in 2019 was 3.3 minutes against 10 seconds to 2.8 minutes in peer cities. Every transfer is a call the agent handled that resolved nothing.
The audit also recorded what residents complain about most when they do get through: incomplete or incorrectly closed service requests. Only 3,187 pieces of feedback were logged against 3.3 million requests between 2016 and 2020. A resident who cannot see why a case closed calls to ask. We wrote about that loop in What does "Closed - See Comments" mean on a MyLA311 request?
What a call costs, and what a call is worth
The Pew Charitable Trusts' 15 city study put the average cost of a 311 call at $3.39, with Detroit highest at $7.78. Gartner's work for Minneapolis found a call or email cost about $4.50 against 50 cents for web self service. Toronto told its 2024 budget committee a call costs $11 to $16 and an app interaction about 10 cents. Philadelphia reported its 311 app cut calls 15 percent and costs 50 percent.
Those figures explain why every city pushes residents toward apps. They also hide the harder problem. Channel shift does not help the resident in Marina del Rey who opens the City of Los Angeles app for a pothole on county land, or the Long Beach resident who searches "LA 311." The app cannot file it, the agent cannot file it, and the resident either gives up or calls. The Controller's audit named the fix in 2021: divert callers away from 311 for things it cannot resolve, and get them to the right destination quickly. Minneapolis measured the same problem before it built 311 at all: 20 to 30 percent of calls misrouted, and more than 60 percent of calls to police.
Where the wrong door starts: jurisdiction
Los Angeles County has 88 incorporated cities. A "Los Angeles, CA" mailing address is not proof you are in the City of Los Angeles, and MyLA311 correctly refuses locations outside city limits. Neighboring jurisdictions use a patchwork of apps, web forms, phone numbers, and vendors, while state routes may fall under Caltrans. The fragmentation itself is the problem: residents experience one continuous metro area, but reporting responsibility changes at government boundaries they may never see.
This is not a Los Angeles quirk. It is the structure of American local government, and it is why a share of every city's 311 volume is residents of somewhere else.
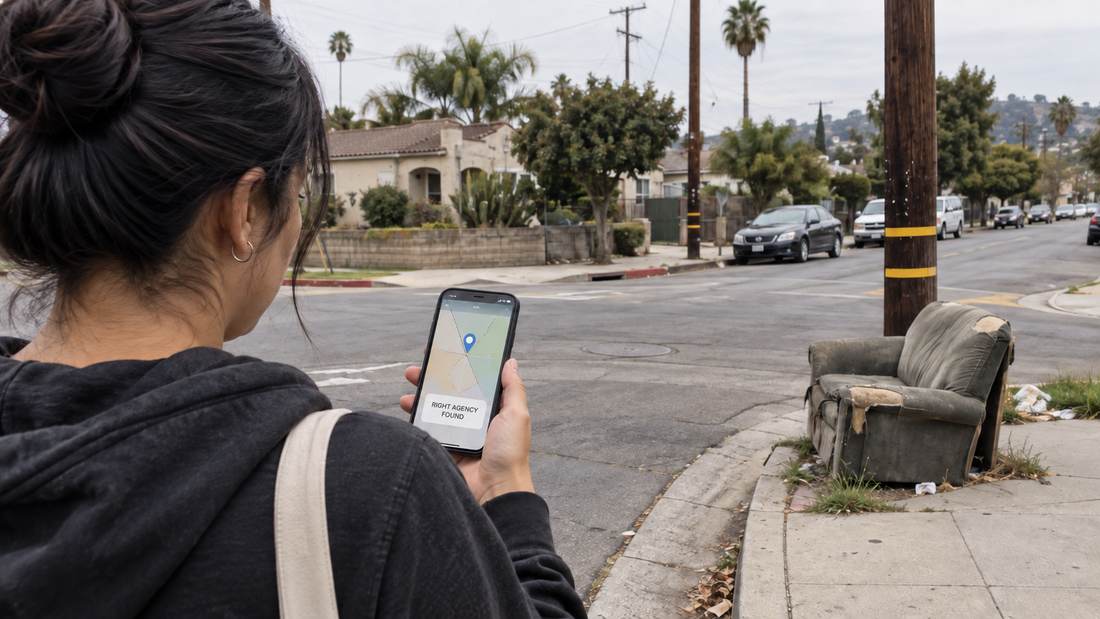
We can see the effect in our own early data, although this is a pilot sample and should not be treated as representative of Los Angeles residents overall. From July through August 27, residents submitted CLARK AI reports at 42 distinct sites inside the City of Los Angeles and 34 distinct sites outside it. Forty five percent of those distinct sites were places the City cannot fix: Marina del Rey, which is unincorporated county land and home to our office; Long Beach; Monterey Park; Alhambra; Culver City. One report inside the postal city, TFS-001650, was rejected by MyLA311 because the address sat outside the municipal boundary. Same street name, different government.
How Scout Mode handles it
CLARK AI checks jurisdiction from the phone's location before anything is sent. Inside the City of Los Angeles it files the report through 311 after a human review and tracks it to a city reported outcome. Everywhere else it runs Scout Mode: it still identifies and measures the problem and assembles the full report, then produces a one page Street Report with the responsible agency's phone number and website so the resident can send it through the right door. A verified city directory covers supported metros; for cities outside that directory, an AI lookup can identify a contact and is shown clearly as unverified.
That design targets three sources of avoidable contact. First, the resident can see the responsible agency before contacting an agent, reducing the chance that an out of jurisdiction issue enters the wrong queue. Second, a report that does reach 311 carries a photo, GPS coordinates, an issue type, a description, and, on supported LiDAR iPhones, a measurement. That reduces the amount of context that has to be reconstructed later. Third, proactive tracking can reduce the need for a resident to call simply to ask what happened, because the tracker moves Received, On It, Resolved as the city updates the case, with the closure type recorded when available.
Why we think 20 to 35 percent is plausible
This is not a measured CLARK AI deflection rate. It is a scenario range built around the Los Angeles Controller's independently estimated 21 percent call volume reduction opportunity from addressing the five most frequently transferred call types. We then ask whether jurisdiction screening, structured intake, and proactive status information could create additional deflection on routine street condition contacts. Those effects overlap, so they should not be added mechanically.
| Signal | What the source actually tells us | How we use it |
|---|---|---|
| LA transfers | More than 40% of answered LA311 calls were transferred; the Controller estimated a 21% call volume reduction from addressing the five most frequently transferred call types. | Primary anchor. This is the strongest independent estimate for the behavior we are targeting. |
| Minneapolis misrouting | Before 311, 20 to 30% of calls were misrouted, and more than 60% of calls to police were misdirected. | Shows that wrong door contact can be a material share of government call traffic. |
| TFS jurisdiction sample | 34 of 76 distinct CLARK reporting sites, or 45%, were outside the City of Los Angeles. | Shows that jurisdiction confusion exists in our pilot, but the sample is small and geographically biased, so we do not use 45% as a citywide deflection rate. |
| Digital channel shift | Philadelphia reported 15% fewer calls after its 311 app; LA already receives 80% of requests through its own digital channels. | Suggests additional pure phone to app migration in LA may be limited, so our thesis is about better routing and intake, not simply moving residents to another screen. |
| Better status communication | LA identifies incomplete or incorrectly closed requests as a common source of feedback. Toronto is now expanding service request milestones and progress updates to improve transparency and reduce follow-up inquiries. | Supports the direction of the effect, but not a precise percentage of calls saved. |
So why publish 20 to 35 percent? Because 21 percent already exists as an auditor produced Los Angeles call volume opportunity from transfer behavior alone. We use 20 percent as a conservative lower bound around that anchor. The upper end assumes that jurisdiction screening, better structured intake, and proactive status information produce additional deflection among routine street condition contacts without pretending those effects are independent.
The range should not be extrapolated to permits, animal services, or every 311 contact. It is a hypothesis about routine street condition reporting, where the request is usually high volume, geographically specific, and structurally simple enough to route before an agent becomes involved.
There is also fresh evidence that other cities are moving in this direction. In 2026, Toronto approved a 311 Front-End Redesign built around a simpler self-service experience with AI capabilities that the City describes as an "intelligent front door." Its companion "Closing the Loop" initiative adds more detailed service request milestones and progress updates. Toronto says clearer intake and better status communication should improve first-attempt accuracy and reduce the need for follow-up inquiries.
What would 100,000 fewer calls be worth?
Published benchmarks put live 311 contact handling at roughly $3.39 to $4.50 per call in the Pew and Minneapolis examples. At those benchmarks, 100,000 avoided calls represent about $339,000 to $450,000 in gross handling cost equivalent.
That is not the same as a city immediately saving that amount in cash. Contact centers carry fixed labor, technology, and facility costs. The near term value may show up instead as shorter wait times, more capacity for residents who still need an agent, less overtime, or the ability to absorb growth without adding staff.